Every year, the University submits a report on our environmental management work to the Swedish Environmental Protection Agency and the Ministry of Education and Research. The report for 2025 has now been approved and published.
“The 2025 results show that the University is well on the way to meeting most of the targets in our internal sustainability plan. However, we can also see that continued efforts are needed to achieve the desired sustainability outcomes, not least in relation to the climate target of carbon neutrality by 2045,” says Claes Nilén, Environmental Manager at LU Estates.
In addition to monitoring activities outlined in the university’s sustainability plan, the report focuses on three key areas, summarised in this article: business travel, energy consumption and environmental requirements in procurement. At the bottom, there is also a diagram showing an estimate of the University’s total greenhouse gas emissions.
Travel: new travel habits following the pandemic
More than 95% of greenhouse gas emissions from business travel come from air travel. Therefore, it is primarily changes in air travel that affect total emissions in this category.
The distance covered by short-haul flights decreased by 15% compared with last year. The distance covered by long-haul flights and the total flight distance remained virtually unchanged compared with previous years but show a downward trend over time.
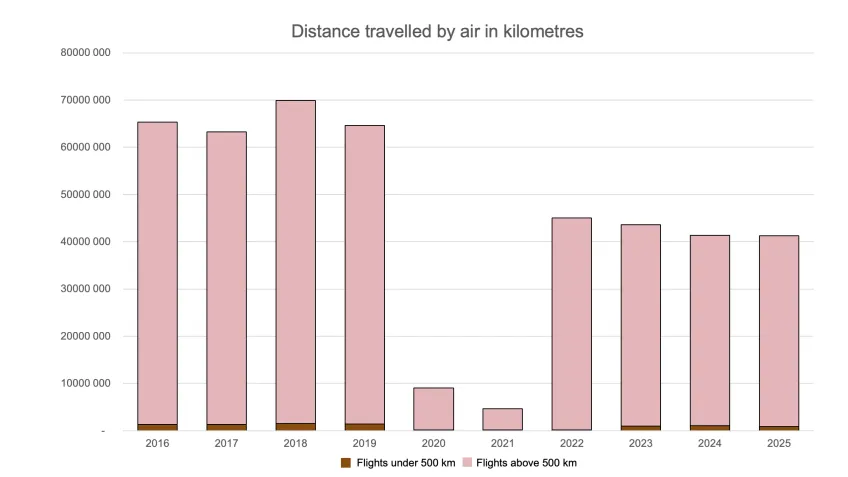
If one compares flight distances before and after the pandemic, it is evident that they are almost 35% shorter after the pandemic (on average over four years before and after, respectively). Digital meetings remain very common — over 395,000 were held in 2025.
Travel by car and bus has decreased, and consequently emissions from these journeys have also fallen. Travel by train has increased, which is positive as this is by far the mode of transport with the lowest emissions per passenger-kilometre.
Read more about what you need to consider before, during and after a business trip: Business travel | Staff Pages
Energy: more efficient buildings and heat recovery from MAX IV
Over the past ten years, the University’s energy consumption has fluctuated slightly, but has remained at roughly the same level over time. Energy consumption at MAX IV has increased over time and currently accounts for 23% of total energy consumption. The rest of the University shows a downward trend.
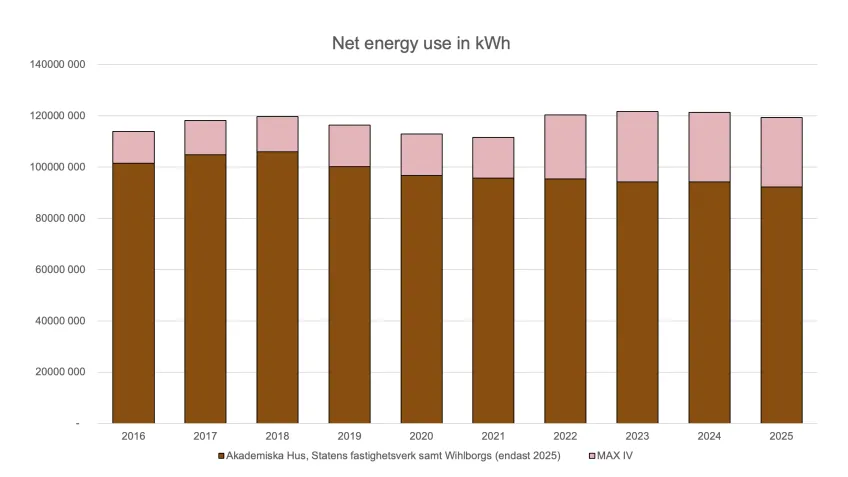
The total energy supplied to MAX IV is roughly double the size of the pink section in the graph, which shows net energy consumption. However, MAX IV converts approximately half of the energy it uses into heat that is fed into the district heating network.
During the year, several measures were implemented to boost electricity generation and improve energy efficiency, such as the installation of solar panels on several buildings, improved window solutions and more efficient lighting, ventilation and compressed air systems.
This year, there has been a clear improvement in energy performance per square metre across the premises, which is due to the measures mentioned above, but also to the fact that the monitoring has been expanded to include data from an additional property owner. The newly included premises are mainly offices and teaching rooms, which have relatively low energy consumption.
For several years now, the University has been purchasing only renewable electricity, and district heating and cooling in Lund are practically 100% renewable.
Read more about how Lund University is working to save energy and how we can all contribute: Save energy | Staff Pages
Procurement: more contracts with sustainability requirements
The proportion of procurements with sustainability requirements has increased, both in terms of number and value. In 2025, 40% of procurements included sustainability requirements, corresponding to 21% of the total procurement value. This is a clear increase compared with 2024, when the corresponding figures stood at 16% and 14% respectively.
In recent years, the University has developed a process that provides procurement officers with clear guidance on when and which sustainability requirements to apply. The basic rule is that procurement officers should use criteria from the National Agency for Public Procurement where relevant. One challenge, however, is that the criteria are often tailored to regions and municipalities, making it more difficult to find requirements that suit the University’s needs.
“Through a collaboration between several higher education institutions, we have now developed sustainability criteria for research equipment, one of our largest procurement categories. This involves, for example, longer warranty periods and better access to spare parts. The guidance will come into use in 2026”, says Anja Björnberg Ekstrand, Procurement Officer at the Division of Finances.
The Division of IT has also changed its strategy for managing and purchasing equipment. For example, there used to be a routine of replacing laptops every three years, which has now been replaced by a needs-based approach where equipment can remain in use if it meets operational requirements. This contributes to a longer product lifespan and a reduced number of devices being discarded prematurely.
Read more about sustainability in purchasing and procurement:
- How to make a purchase | Staff Pages
- Sustainable procurement | Staff Pages
- Sustainable food purchases and events | Staff Pages
- In Swedish: Reuse and waste prevention Återbruk och förebygga avfall | Medarbetarwebben
- In Swedish: Cirkulära möbelflöden och inköp av ny inredning
Lund University’s carbon footprint
In addition to the environmental management report, the University also produces a so-called environmental spend analysis to map the carbon footprint of purchases of various goods and services. The University calculates the carbon footprint by multiplying the purchase cost by an indicator showing the climate impact in carbon dioxide equivalent (CO2e) per SEK for different categories of goods and services. The analysis is based on invoiced amounts. Purchases that have not been invoiced are not included.
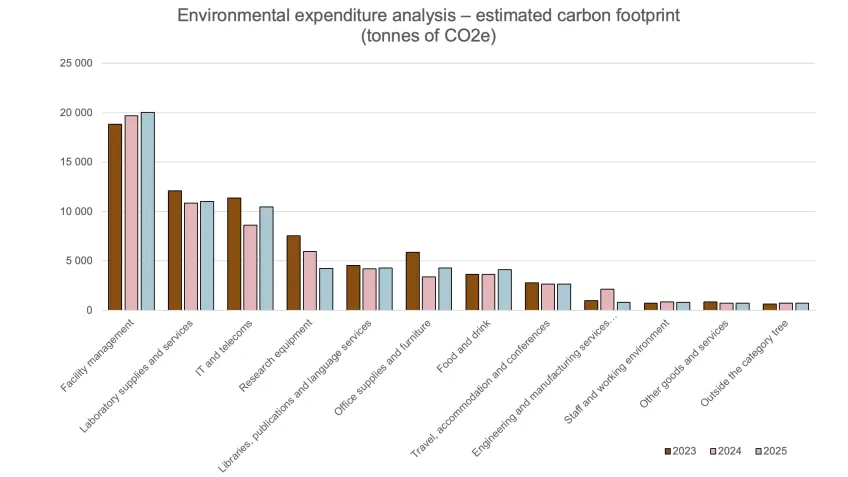
The environmental impact analysis shows that purchases in the categories of Property Management, Laboratory Supplies and Services, IT and Telecom and Research Equipment have the greatest carbon footprint.
An environmental spend analysis is best used to provide a snapshot of which procurement categories generate a high climate impact. As tools for year-on-year monitoring, the method has several limitations. For example, the calculations are based on national indicators from the National Agency for Public Procurement, and therefore the results cannot be used to monitor the effect of choosing a product with a lower climate impact. That product may have a higher price, which then results in higher procurement costs and thus a larger carbon footprint in the environmental spend analysis rather than a smaller one.
For the university, the categories Research Equipment and Laboratory Consumables and Services are particularly uncertain, with general indicators applied to most purchases, even though the purchases relate to different products. Different calculation methods also yield different results. In the environmental spend analysis, the Travel, Accommodation and Conferences category amounts to approximately 3000 tons CO2e, whilst the contracted travel agency’s calculation method (DEFRA including the high-altitude effect) estimates emissions from air travel at approximately 6000 tons CO2e.
Climate neutrality target
Lund University aims to be a climate-neutral organisation by 2045, in line with Sweden’s national climate targets.
“There are challenges in reducing emissions from, for example, facility management and laboratory equipment. A great deal of good work is being done across the university, such as optimising the use of premises and setting increasingly stringent sustainability requirements when purchasing equipment. But if we want to see more dramatic reductions, more far-reaching efforts are required, says Claes Nilén, Environmental Manager.
Find out more about the internal sustainability work at Lund University and how we can all contribute: Sustainable at work | Staff Pages
Read the full report: Report on Environmental Management Work 2025 (in Swedish): redovisning-miljoledning-2025-ej-tillg.pdf
